
Indicator Gauge Icon Legend
Legend Colors
Red is bad, green is good, blue is not statistically different/neutral.
Compared to Distribution
 the value is in the best half of communities.
 the value is in the 2nd worst quarter of communities.
 the value is in the worst quarter of communities.
Compared to Target
 meets target;
  does not meet target.
Compared to a Single Value
 lower than the comparison value;
 higher than the comparison value;
 not statistically different from comparison value.
Trend

 non-significant change over time;
 significant change over time;
  no change over time.
Compared to Prior Value
 higher than the previous measurement period;
 lower than the previous measurement period;
 no statistically different change from previous measurement period.
 Significantly better than the overall value
 Significantly worse than the overall value
 No significant difference with the overall value
 No data on significance available
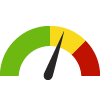
High School Drop Out Rate
This indicator is archived and is no longer being updated. Click to learn more
This indicator shows the percentage of students from a class of beginning ninth graders who drop out before completing their high school education.
Why is this important?
High school dropouts are more likely than people who finish high school to lack the basic skills required to function in an increasingly complicated job market and society. Adults with limited education levels are more likely to be unemployed, on government assistance, or involved in crime.
Clear this location
County: Dallas
4.4%
Source:
Texas Education Agency
Measurement period: 2021
Maintained by: Conduent Healthy Communities Institute
Last update: May 2023
Measurement period: 2021
Maintained by: Conduent Healthy Communities Institute
Last update: May 2023
Filter(s) for this location: Metropolitan Statistical Area (MSA): Dallas-Plano-Irving, Substate Region: 3a
Compared to


Graph Selections

| County | Source | Measurement Period | Percent | |
|---|---|---|---|---|
There are 17 County values. The lowest value is 0.2%, and the highest value is 5.2%.
Half of the values are between 0.8% and 1.3%.
The middle (median) value is 1.1%.
Data Source
- Texas Education Agency
Maintained By: Conduent Healthy Communities Institute (Methodology)
Filed under: Education / Student Performance K-12, Education / Educational Attainment, Social Determinants of Health, Teens