
Search for Indicators
All Data
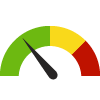
Indicator Gauge Icon Legend
Legend Colors
Red is bad, green is good, blue is not statistically different/neutral.
Compared to Distribution
 the value is in the best half of communities.
 the value is in the 2nd worst quarter of communities.
 the value is in the worst quarter of communities.
Compared to Target
 meets target;
  does not meet target.
Compared to a Single Value
 lower than the comparison value;
 higher than the comparison value;
 not statistically different from comparison value.
Trend

 non-significant change over time;
 significant change over time;
  no change over time.
Compared to Prior Value
 higher than the previous measurement period;
 lower than the previous measurement period;
 no statistically different change from previous measurement period.
County: Tarrant
Health / Alcohol & Drug Use
Value
Compared to:
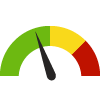
County: Tarrant Adults who Binge Drink
County: Tarrant Adults who Binge Drink
16.5%
(2021)
Compared to:

TX Counties
The distribution is based on data from 254 Texas counties.
U.S. Counties
The distribution is based on data from 3,074 U.S. counties and county equivalents.
US Value
(15.5%)
The regional value is compared to the national value.
County: Tarrant Age-Adjusted Drug and Opioid-Involved Overdose Death Rate
County: Tarrant Age-Adjusted Drug and Opioid-Involved Overdose Death Rate
10.2
Deaths per 100,000 population
(2018-2020)
Compared to:
U.S. Counties
The distribution is based on data from 1,303 U.S. counties and county equivalents.
TX Value
(11.8)
The regional value is compared to the Texas State value.
US Value
(23.5)
The regional value is compared to the national value.
Prior Value
(9.6)
Prior Value compares a measured value with the previously measured value. Confidence intervals were taken into account in determining the direction of the comparison.
County: Tarrant Death Rate due to Drug Poisoning
County: Tarrant Death Rate due to Drug Poisoning
13.9
Deaths per 100,000 population
(2019-2021)
Compared to:

U.S. Counties
The distribution is based on data from 1,899 U.S. counties and county equivalents.
TX Value
(14.0)
The regional value is compared to the Texas State value.
US Value
(27.2)
The regional value is compared to the national value.
HP 2030 Target
(20.7)
<div>SU-03: Reduce drug overdose deaths <strong>(LEADING HEALTH INDICATOR)</strong></div>
County: Tarrant
Health / Cancer
Value
Compared to:
County: Tarrant Adults with Cancer
County: Tarrant Adults with Cancer
5.8%
(2021)
Compared to:
TX Counties
The distribution is based on data from 254 Texas counties.
U.S. Counties
The distribution is based on data from 3,074 U.S. counties and county equivalents.
US Value
(7.0%)
The regional value is compared to the national value.
County: Tarrant Age-Adjusted Death Rate due to Breast Cancer
County: Tarrant Age-Adjusted Death Rate due to Breast Cancer
20.7
Deaths per 100,000 females
(2016-2020)
Compared to:

U.S. Counties
The distribution is based on data from 1,755 U.S. counties and county equivalents.
TX Value
(19.7)
The regional value is compared to the Texas State value.
US Value
(19.6)
The regional value is compared to the national value.
Prior Value
(20.9)
Prior Value compares a measured value with the previously measured value. Confidence intervals were taken into account in determining the direction of the comparison.
Trend
This comparison measures the indicator’s values over multiple time periods.<br>The Mann-Kendall Test for Statistical Significance is used to evaluate the trend<br>over 4 to 10 periods of measure, subject to data availability and comparability.
HP 2030 Target
(15.3)
County: Tarrant Age-Adjusted Death Rate due to Cancer
County: Tarrant Age-Adjusted Death Rate due to Cancer
149.2
Deaths per 100,000 population
(2016-2020)
Compared to:
TX Counties
The distribution is based on data from 243 Texas counties.
U.S. Counties
The distribution is based on data from 3,085 U.S. counties and county equivalents.
TX Value
(144.5)
The regional value is compared to the Texas State value.
US Value
(149.4)
The regional value is compared to the national value.
Prior Value
(150.7)
Prior Value compares a measured value with the previously measured value. Confidence intervals were taken into account in determining the direction of the comparison.
Trend
This comparison measures the indicator’s values over multiple time periods.<br>The Mann-Kendall Test for Statistical Significance is used to evaluate the trend<br>over 4 to 10 periods of measure, subject to data availability and comparability.
HP 2030 Target
(122.7)
County: Tarrant Age-Adjusted Death Rate due to Colorectal Cancer
County: Tarrant Age-Adjusted Death Rate due to Colorectal Cancer
13.2
Deaths per 100,000 population
(2016-2020)
Compared to:
TX Counties
The distribution is based on data from 147 Texas counties.
U.S. Counties
The distribution is based on data from 2,174 U.S. counties and county equivalents.
TX Value
(13.7)
The regional value is compared to the Texas State value.
US Value
(13.1)
The regional value is compared to the national value.
Prior Value
(13.5)
Prior Value compares a measured value with the previously measured value. Confidence intervals were taken into account in determining the direction of the comparison.
Trend
This comparison measures the indicator’s values over multiple time periods.<br>The Mann-Kendall Test for Statistical Significance is used to evaluate the trend<br>over 4 to 10 periods of measure, subject to data availability and comparability.
HP 2030 Target
(8.9)
County: Tarrant Age-Adjusted Death Rate due to Lung Cancer
County: Tarrant Age-Adjusted Death Rate due to Lung Cancer
34.8
Deaths per 100,000 population
(2016-2020)
Compared to:
TX Counties
The distribution is based on data from 188 Texas counties.
U.S. Counties
The distribution is based on data from 2,752 U.S. counties and county equivalents.
TX Value
(31.3)
The regional value is compared to the Texas State value.
US Value
(35.0)
The regional value is compared to the national value.
Prior Value
(36.3)
Prior Value compares a measured value with the previously measured value. Confidence intervals were taken into account in determining the direction of the comparison.
Trend
This comparison measures the indicator’s values over multiple time periods.<br>The Mann-Kendall Test for Statistical Significance is used to evaluate the trend<br>over 4 to 10 periods of measure, subject to data availability and comparability.
HP 2030 Target
(25.1)
County: Tarrant Age-Adjusted Death Rate due to Prostate Cancer
County: Tarrant Age-Adjusted Death Rate due to Prostate Cancer
19.0
Deaths per 100,000 males
(2016-2020)
Compared to:
U.S. Counties
The distribution is based on data from 1,576 U.S. counties and county equivalents.
TX Value
(17.6)
The regional value is compared to the Texas State value.
US Value
(18.8)
The regional value is compared to the national value.
Prior Value
(18.2)
Prior Value compares a measured value with the previously measured value. Confidence intervals were taken into account in determining the direction of the comparison.
Trend
This comparison measures the indicator’s values over multiple time periods.<br>The Mann-Kendall Test for Statistical Significance is used to evaluate the trend<br>over 4 to 10 periods of measure, subject to data availability and comparability.
HP 2030 Target
(16.9)
County: Tarrant All Cancer Incidence Rate
County: Tarrant All Cancer Incidence Rate
430.0
Cases per 100,000 population
(2016-2020)
Compared to:
TX Counties
The distribution is based on data from 251 Texas counties.
U.S. Counties
The distribution is based on data from 2,693 U.S. counties and county equivalents.
TX Value
(412.2)
The regional value is compared to the Texas State value.
US Value
(442.3)
The regional value is compared to the national value.
Prior Value
(435.7)
Prior Value compares a measured value with the previously measured value. Confidence intervals were taken into account in determining the direction of the comparison.
Trend
This comparison measures the indicator’s values over multiple time periods.<br>The Mann-Kendall Test for Statistical Significance is used to evaluate the trend<br>over 4 to 10 periods of measure, subject to data availability and comparability.
County: Tarrant Breast Cancer Incidence Rate
County: Tarrant Breast Cancer Incidence Rate
127.3
Cases per 100,000 females
(2016-2020)
Compared to:

TX Counties
The distribution is based on data from 203 Texas counties.
U.S. Counties
The distribution is based on data from 2,478 U.S. counties and county equivalents.
TX Value
(116.3)
The regional value is compared to the Texas State value.
US Value
(127.0)
The regional value is compared to the national value.
Prior Value
(127.1)
Prior Value compares a measured value with the previously measured value. Confidence intervals were taken into account in determining the direction of the comparison.
Trend
This comparison measures the indicator’s values over multiple time periods.<br>The Mann-Kendall Test for Statistical Significance is used to evaluate the trend<br>over 4 to 10 periods of measure, subject to data availability and comparability.
County: Tarrant Cancer: Medicare Population
County: Tarrant Cancer: Medicare Population
12.0%
(2022)
Compared to:


TX Counties
The distribution is based on data from 254 Texas counties.
U.S. Counties
The distribution is based on data from 3,129 U.S. counties and county equivalents.
TX Value
(11.0%)
The regional value is compared to the Texas State value.
US Value
(12.0%)
The regional value is compared to the national value.
Prior Value
(11.0%)
Prior Value compares a measured value with the previously measured value. Confidence intervals were not taken into account in determining the direction of the comparison.
Trend
This comparison measures the indicator’s values over multiple time periods.<br>The Mann-Kendall Test for Statistical Significance is used to evaluate the trend<br>over 4 to 10 periods of measure, subject to data availability and comparability.
County: Tarrant Cervical Cancer Incidence Rate
County: Tarrant Cervical Cancer Incidence Rate
9.1
Cases per 100,000 females
(2016-2020)
Compared to:
U.S. Counties
The distribution is based on data from 696 U.S. counties and county equivalents.
TX Value
(9.4)
The regional value is compared to the Texas State value.
US Value
(7.5)
The regional value is compared to the national value.
Prior Value
(8.9)
Prior Value compares a measured value with the previously measured value. Confidence intervals were taken into account in determining the direction of the comparison.
Trend
This comparison measures the indicator’s values over multiple time periods.<br>The Mann-Kendall Test for Statistical Significance is used to evaluate the trend<br>over 4 to 10 periods of measure, subject to data availability and comparability.
County: Tarrant Cervical Cancer Screening: 21-65
County: Tarrant Cervical Cancer Screening: 21-65
77.0%
(2020)
Compared to:

TX Counties
The distribution is based on data from 254 Texas counties.
U.S. Counties
The distribution is based on data from 3,141 U.S. counties and county equivalents.
US Value
(82.8%)
The regional value is compared to the national value.
County: Tarrant Colon Cancer Screening
County: Tarrant Colon Cancer Screening
60.1%
(2018)
Compared to:

TX Counties
The distribution is based on data from 254 Texas counties.
U.S. Counties
The distribution is based on data from 3,142 U.S. counties and county equivalents.
US Value
(66.4%)
The regional value is compared to the national value.
County: Tarrant Colon Cancer Screening: USPSTF Recommendation
County: Tarrant Colon Cancer Screening: USPSTF Recommendation
66.4%
(2020)
Compared to:
TX Counties
The distribution is based on data from 254 Texas counties.
U.S. Counties
The distribution is based on data from 3,141 U.S. counties and county equivalents.
US Value
(72.4%)
The regional value is compared to the national value.
County: Tarrant Colorectal Cancer Incidence Rate
County: Tarrant Colorectal Cancer Incidence Rate
36.4
Cases per 100,000 population
(2016-2020)
Compared to:
TX Counties
The distribution is based on data from 192 Texas counties.
U.S. Counties
The distribution is based on data from 2,401 U.S. counties and county equivalents.
TX Value
(37.1)
The regional value is compared to the Texas State value.
US Value
(36.5)
The regional value is compared to the national value.
Prior Value
(37.4)
Prior Value compares a measured value with the previously measured value. Confidence intervals were taken into account in determining the direction of the comparison.
Trend
This comparison measures the indicator’s values over multiple time periods.<br>The Mann-Kendall Test for Statistical Significance is used to evaluate the trend<br>over 4 to 10 periods of measure, subject to data availability and comparability.
County: Tarrant Lung and Bronchus Cancer Incidence Rate
County: Tarrant Lung and Bronchus Cancer Incidence Rate
49.7
Cases per 100,000 population
(2016-2020)
Compared to:
TX Counties
The distribution is based on data from 198 Texas counties.
U.S. Counties
The distribution is based on data from 2,471 U.S. counties and county equivalents.
TX Value
(46.5)
The regional value is compared to the Texas State value.
US Value
(54.0)
The regional value is compared to the national value.
Prior Value
(51.9)
Prior Value compares a measured value with the previously measured value. Confidence intervals were taken into account in determining the direction of the comparison.
Trend
This comparison measures the indicator’s values over multiple time periods.<br>The Mann-Kendall Test for Statistical Significance is used to evaluate the trend<br>over 4 to 10 periods of measure, subject to data availability and comparability.
County: Tarrant Mammogram in Past 2 Years: 50-74
County: Tarrant Mammogram in Past 2 Years: 50-74
72.7%
(2020)
Compared to:
TX Counties
The distribution is based on data from 254 Texas counties.
U.S. Counties
The distribution is based on data from 3,141 U.S. counties and county equivalents.
US Value
(78.2%)
The regional value is compared to the national value.
HP 2030 Target
(80.3%)
County: Tarrant Mammography Screening: Medicare Population
County: Tarrant Mammography Screening: Medicare Population
49.0%
(2022)
Compared to:
TX Counties
The distribution is based on data from 250 Texas counties.
U.S. Counties
The distribution is based on data from 3,123 U.S. counties and county equivalents.
TX Value
(42.0%)
The regional value is compared to the Texas State value.
US Value
(47.0%)
The regional value is compared to the national value.
Prior Value
(46.0%)
Prior Value compares a measured value with the previously measured value. Confidence intervals were not taken into account in determining the direction of the comparison.
Trend
This comparison measures the indicator’s values over multiple time periods.<br>The Mann-Kendall Test for Statistical Significance is used to evaluate the trend<br>over 4 to 10 periods of measure, subject to data availability and comparability.
County: Tarrant Oral Cavity and Pharynx Cancer Incidence Rate
County: Tarrant Oral Cavity and Pharynx Cancer Incidence Rate
12.5
Cases per 100,000 population
(2016-2020)
Compared to:
TX Counties
(2011-2015)
The distribution is based on data from 181 Texas counties.
U.S. Counties
The distribution is based on data from 1,706 U.S. counties and county equivalents.
TX Value
(11.2)
The regional value is compared to the Texas State value.
US Value
(11.9)
The regional value is compared to the national value.
Prior Value
(12.3)
Prior Value compares a measured value with the previously measured value. Confidence intervals were taken into account in determining the direction of the comparison.
Trend
This comparison measures the indicator’s values over multiple time periods.<br>The Mann-Kendall Test for Statistical Significance is used to evaluate the trend<br>over 4 to 10 periods of measure, subject to data availability and comparability.
County: Tarrant Prostate Cancer Incidence Rate
County: Tarrant Prostate Cancer Incidence Rate
103.6
Cases per 100,000 males
(2016-2020)
Compared to:
TX Counties
The distribution is based on data from 201 Texas counties.
U.S. Counties
The distribution is based on data from 2,500 U.S. counties and county equivalents.
TX Value
(103.4)
The regional value is compared to the Texas State value.
US Value
(110.5)
The regional value is compared to the national value.
Prior Value
(105.0)
Prior Value compares a measured value with the previously measured value. Confidence intervals were taken into account in determining the direction of the comparison.
Trend
This comparison measures the indicator’s values over multiple time periods.<br>The Mann-Kendall Test for Statistical Significance is used to evaluate the trend<br>over 4 to 10 periods of measure, subject to data availability and comparability.
County: Tarrant
Health / Diabetes
Value
Compared to:
County: Tarrant Adults 20+ with Diabetes
County: Tarrant Adults 20+ with Diabetes
9.9%
(2021)
Compared to:
TX Counties
The distribution is based on data from 254 Texas counties.
U.S. Counties
The distribution is based on data from 3,074 U.S. counties and county equivalents.
Prior Value
(10.1%)
Prior Value compares a measured value with the previously measured value. Confidence intervals were taken into account in determining the direction of the comparison.
Trend
This comparison measures the indicator’s values over multiple time periods.<br>The Mann-Kendall Test for Statistical Significance is used to evaluate the trend<br>over 4 to 10 periods of measure, subject to data availability and comparability.
County: Tarrant Age-Adjusted Death Rate due to Diabetes
County: Tarrant Age-Adjusted Death Rate due to Diabetes
24.7
Deaths per 100,000 population
(2018-2020)
Compared to:
TX Counties
The distribution is based on data from 133 Texas counties.
U.S. Counties
The distribution is based on data from 1,937 U.S. counties and county equivalents.
TX Value
(23.8)
The regional value is compared to the Texas State value.
US Value
(22.6)
The regional value is compared to the national value.
Prior Value
(22.2)
Prior Value compares a measured value with the previously measured value. Confidence intervals were taken into account in determining the direction of the comparison.
Trend
This comparison measures the indicator’s values over multiple time periods.<br>The Mann-Kendall Test for Statistical Significance is used to evaluate the trend<br>over 4 to 10 periods of measure, subject to data availability and comparability.
County: Tarrant Diabetes: Medicare Population
County: Tarrant Diabetes: Medicare Population
25.0%
(2022)
Compared to:
TX Counties
The distribution is based on data from 254 Texas counties.
U.S. Counties
The distribution is based on data from 3,129 U.S. counties and county equivalents.
TX Value
(25.0%)
The regional value is compared to the Texas State value.
US Value
(24.0%)
The regional value is compared to the national value.
Prior Value
(26.0%)
Prior Value compares a measured value with the previously measured value. Confidence intervals were not taken into account in determining the direction of the comparison.
Trend
This comparison measures the indicator’s values over multiple time periods.<br>The Mann-Kendall Test for Statistical Significance is used to evaluate the trend<br>over 4 to 10 periods of measure, subject to data availability and comparability.
County: Tarrant
Health / Disabilities
Value
Compared to:
County: Tarrant Adults with Disability Living in Poverty
County: Tarrant Adults with Disability Living in Poverty
18.2%
(2018-2022)
Compared to:
TX Counties
The distribution is based on data from 253 Texas counties.
U.S. Counties
The distribution is based on data from 3,132 U.S. counties and county equivalents.
TX Value
(22.0%)
The regional value is compared to the Texas State value.
US Value
(24.9%)
The regional value is compared to the national value.
Trend
This comparison measures the indicator’s values over multiple time periods.<br>The Mann-Kendall Test for Statistical Significance is used to evaluate the trend<br>over 4 to 10 periods of measure, subject to data availability and comparability.
County: Tarrant Children with a Disability
County: Tarrant Children with a Disability
3.6%
(2018-2022)
Compared to:


TX Value
(4.6%)
The regional value is compared to the Texas State value.
US Value
(4.5%)
The regional value is compared to the national value.
Trend
This comparison measures the indicator’s values over multiple time periods.<br>The Mann-Kendall Test for Statistical Significance is used to evaluate the trend<br>over 4 to 10 periods of measure, subject to data availability and comparability.
County: Tarrant Persons with a Cognitive Difficulty
County: Tarrant Persons with a Cognitive Difficulty
4.0%
(2018-2022)
Compared to:
TX Value
(4.8%)
The regional value is compared to the Texas State value.
US Value
(5.3%)
The regional value is compared to the national value.
Trend
This comparison measures the indicator’s values over multiple time periods.<br>The Mann-Kendall Test for Statistical Significance is used to evaluate the trend<br>over 4 to 10 periods of measure, subject to data availability and comparability.
County: Tarrant Persons with a Disability
County: Tarrant Persons with a Disability
9.8%
(2018-2022)
Compared to:
TX Value
(11.7%)
The regional value is compared to the Texas State value.
US Value
(12.9%)
The regional value is compared to the national value.
Trend
This comparison measures the indicator’s values over multiple time periods.<br>The Mann-Kendall Test for Statistical Significance is used to evaluate the trend<br>over 4 to 10 periods of measure, subject to data availability and comparability.
County: Tarrant Persons with a Hearing Difficulty
County: Tarrant Persons with a Hearing Difficulty
2.6%
(2018-2022)
Compared to:

TX Value
(3.3%)
The regional value is compared to the Texas State value.
US Value
(3.6%)
The regional value is compared to the national value.
Trend
This comparison measures the indicator’s values over multiple time periods.<br>The Mann-Kendall Test for Statistical Significance is used to evaluate the trend<br>over 4 to 10 periods of measure, subject to data availability and comparability.
County: Tarrant Persons with a Self-Care Difficulty
County: Tarrant Persons with a Self-Care Difficulty
1.8%
(2018-2022)
Compared to:
TX Value
(2.4%)
The regional value is compared to the Texas State value.
US Value
(2.6%)
The regional value is compared to the national value.
Trend
This comparison measures the indicator’s values over multiple time periods.<br>The Mann-Kendall Test for Statistical Significance is used to evaluate the trend<br>over 4 to 10 periods of measure, subject to data availability and comparability.
County: Tarrant Persons with a Vision Difficulty
County: Tarrant Persons with a Vision Difficulty
2.0%
(2018-2022)
Compared to:

TX Value
(2.5%)
The regional value is compared to the Texas State value.
US Value
(2.4%)
The regional value is compared to the national value.
Trend
This comparison measures the indicator’s values over multiple time periods.<br>The Mann-Kendall Test for Statistical Significance is used to evaluate the trend<br>over 4 to 10 periods of measure, subject to data availability and comparability.
County: Tarrant Persons with an Ambulatory Difficulty
County: Tarrant Persons with an Ambulatory Difficulty
5.0%
(2018-2022)
Compared to:
TX Value
(6.0%)
The regional value is compared to the Texas State value.
US Value
(6.7%)
The regional value is compared to the national value.
Trend
This comparison measures the indicator’s values over multiple time periods.<br>The Mann-Kendall Test for Statistical Significance is used to evaluate the trend<br>over 4 to 10 periods of measure, subject to data availability and comparability.
County: Tarrant
Health / Family Planning
Value
Compared to:
County: Tarrant Infants Born to Mothers with <12 Years Education
County: Tarrant Infants Born to Mothers with <12 Years Education
13.9%
(2019)
Compared to:
TX Counties
The distribution is based on data from 209 Texas counties.
TX Value
(16.0%)
The regional value is compared to the Texas State value.
US Value
(12.1%)
The regional value is compared to the national value. The source for the national value is Centers for Disease Control and Prevention
Prior Value
(13.9%)
Prior Value compares a measured value with the previously measured value. Confidence intervals were not taken into account in determining the direction of the comparison.
Trend
This comparison measures the indicator’s values over multiple time periods.<br>The Mann-Kendall Test for Statistical Significance is used to evaluate the trend<br>over 4 to 10 periods of measure, subject to data availability and comparability.
County: Tarrant Teen Births
County: Tarrant Teen Births
1.5%
(2019)
Compared to:
TX Counties
(2014)
The distribution is based on data from 227 Texas counties.
TX Value
(2.0%)
The regional value is compared to the Texas State value.
US Value
(2.6%)
The regional value is compared to the national value. The source for the national value is Centers for Disease Control and Prevention, National Center for Health Statistics
Prior Value
(1.5%)
Prior Value compares a measured value with the previously measured value. Confidence intervals were not taken into account in determining the direction of the comparison.
Trend
This comparison measures the indicator’s values over multiple time periods.<br>The Mann-Kendall Test for Statistical Significance is used to evaluate the trend<br>over 4 to 10 periods of measure, subject to data availability and comparability.
County: Tarrant
Health / Health Care Access & Quality
Value
Compared to:
County: Tarrant Adults who have had a Routine Checkup
County: Tarrant Adults who have had a Routine Checkup
71.9%
(2021)
Compared to:
TX Counties
The distribution is based on data from 254 Texas counties.
U.S. Counties
The distribution is based on data from 3,074 U.S. counties and county equivalents.
US Value
(73.6%)
The regional value is compared to the national value.
County: Tarrant Adults with Health Insurance
County: Tarrant Adults with Health Insurance
78.6%
(2022)
Compared to:

U.S. Counties
The distribution is based on data from 828 U.S. counties and county equivalents.
TX Value
(77.6%)
The regional value is compared to the Texas State value.
US Value
(88.7%)
The regional value is compared to the national value.
Prior Value
(76.3%)
Prior Value compares a measured value with the previously measured value. Confidence intervals were taken into account in determining the direction of the comparison.
Trend
This comparison measures the indicator’s values over multiple time periods.<br>The Mann-Kendall Test for Statistical Significance is used to evaluate the trend<br>over 4 to 10 periods of measure, subject to data availability and comparability.
County: Tarrant Adults without Health Insurance
County: Tarrant Adults without Health Insurance
19.4%
(2021)
Compared to:
TX Counties
The distribution is based on data from 254 Texas counties.
U.S. Counties
The distribution is based on data from 3,074 U.S. counties and county equivalents.
US Value
(10.8%)
The regional value is compared to the national value.
County: Tarrant Children with Health Insurance
County: Tarrant Children with Health Insurance
88.8%
(2022)
Compared to:
U.S. Counties
The distribution is based on data from 828 U.S. counties and county equivalents.
TX Value
(89.1%)
The regional value is compared to the Texas State value.
US Value
(94.9%)
The regional value is compared to the national value.
Prior Value
(87.2%)
Prior Value compares a measured value with the previously measured value. Confidence intervals were taken into account in determining the direction of the comparison.
Trend
This comparison measures the indicator’s values over multiple time periods.<br>The Mann-Kendall Test for Statistical Significance is used to evaluate the trend<br>over 4 to 10 periods of measure, subject to data availability and comparability.
County: Tarrant Medicare Healthcare Costs
County: Tarrant Medicare Healthcare Costs
$11,621
Dollars per enrollee
(2015)
Compared to:


TX Value
($11,121)
The regional value is compared to the Texas State value.
US Value
($9,729)
The regional value is compared to the national value.
Prior Value
($11,733)
Prior Value compares a measured value with the previously measured value. Confidence intervals were not taken into account in determining the direction of the comparison.
Trend
This comparison measures the indicator’s values over multiple time periods.<br>The Mann-Kendall Test for Statistical Significance is used to evaluate the trend<br>over 4 to 10 periods of measure, subject to data availability and comparability.
County: Tarrant Non-Physician Primary Care Provider Rate
County: Tarrant Non-Physician Primary Care Provider Rate
109
Providers per 100,000 population
(2023)
Compared to:
TX Counties
The distribution is based on data from 252 Texas counties.
U.S. Counties
The distribution is based on data from 3,129 U.S. counties and county equivalents.
TX Value
(109)
The regional value is compared to the Texas State value.
Prior Value
(103)
Prior Value compares a measured value with the previously measured value. Confidence intervals were not taken into account in determining the direction of the comparison.
Trend
This comparison measures the indicator’s values over multiple time periods.<br>The Mann-Kendall Test for Statistical Significance is used to evaluate the trend<br>over 4 to 10 periods of measure, subject to data availability and comparability.
County: Tarrant Persons with Health Insurance
County: Tarrant Persons with Health Insurance
80.1%
(2021)
Compared to:
TX Counties
The distribution is based on data from 254 Texas counties.
U.S. Counties
The distribution is based on data from 3,140 U.S. counties and county equivalents.
TX Value
(79.7%)
The regional value is compared to the Texas State value.
Prior Value
(80.3%)
Prior Value compares a measured value with the previously measured value. Confidence intervals were taken into account in determining the direction of the comparison.
Trend
This comparison measures the indicator’s values over multiple time periods.<br>The Mann-Kendall Test for Statistical Significance is used to evaluate the trend<br>over 4 to 10 periods of measure, subject to data availability and comparability.
HP 2030 Target
(92.4%)
<div>AHS-01: Increase the proportion of people with health insurance <strong>(LEADING HEALTH INDICATOR)</strong></div>
County: Tarrant Persons with Private Health Insurance Only
County: Tarrant Persons with Private Health Insurance Only
58.3%
(2022)
Compared to:

TX Value
(53.8%)
The regional value is compared to the Texas State value.
US Value
(54.8%)
The regional value is compared to the national value.
Prior Value
(55.6%)
Prior Value compares a measured value with the previously measured value. Confidence intervals were not taken into account in determining the direction of the comparison.
Trend
This comparison measures the indicator’s values over multiple time periods.<br>The Mann-Kendall Test for Statistical Significance is used to evaluate the trend<br>over 4 to 10 periods of measure, subject to data availability and comparability.
County: Tarrant Persons with Public Health Insurance Only
County: Tarrant Persons with Public Health Insurance Only
18.2%
(2022)
Compared to:
TX Value
(20.6%)
The regional value is compared to the Texas State value.
US Value
(24.8%)
The regional value is compared to the national value.
Prior Value
(18.7%)
Prior Value compares a measured value with the previously measured value. Confidence intervals were not taken into account in determining the direction of the comparison.
Trend
This comparison measures the indicator’s values over multiple time periods.<br>The Mann-Kendall Test for Statistical Significance is used to evaluate the trend<br>over 4 to 10 periods of measure, subject to data availability and comparability.
County: Tarrant Preventable Hospital Stays: Medicare Population
County: Tarrant Preventable Hospital Stays: Medicare Population
3,477.0
Discharges per 100,000 Medicare enrollees
(2022)
Compared to:
TX Counties
The distribution is based on data from 254 Texas counties.
U.S. Counties
The distribution is based on data from 3,129 U.S. counties and county equivalents.
TX Value
(2,980.0)
The regional value is compared to the Texas State value.
US Value
(2,677.0)
The regional value is compared to the national value.
Prior Value
(3,371.0)
Prior Value compares a measured value with the previously measured value. Confidence intervals were not taken into account in determining the direction of the comparison.
Trend
This comparison measures the indicator’s values over multiple time periods.<br>The Mann-Kendall Test for Statistical Significance is used to evaluate the trend<br>over 4 to 10 periods of measure, subject to data availability and comparability.
County: Tarrant Primary Care Provider Rate
County: Tarrant Primary Care Provider Rate
58
Providers per 100,000 population
(2021)
Compared to:

TX Counties
The distribution is based on data from 231 Texas counties.
U.S. Counties
The distribution is based on data from 2,984 U.S. counties and county equivalents.
TX Value
(60)
The regional value is compared to the Texas State value.
Prior Value
(59)
Prior Value compares a measured value with the previously measured value. Confidence intervals were not taken into account in determining the direction of the comparison.
Trend
This comparison measures the indicator’s values over multiple time periods.<br>The Mann-Kendall Test for Statistical Significance is used to evaluate the trend<br>over 4 to 10 periods of measure, subject to data availability and comparability.
County: Tarrant
Health / Health Information Technology
Value
Compared to:
County: Tarrant Households with an Internet Subscription
County: Tarrant Households with an Internet Subscription
92.1%
(2018-2022)
Compared to:
TX Counties
The distribution is based on data from 254 Texas counties.
U.S. Counties
The distribution is based on data from 3,133 U.S. counties and county equivalents.
TX Value
(88.5%)
The regional value is compared to the Texas State value.
US Value
(88.5%)
The regional value is compared to the national value.
Trend
This comparison measures the indicator’s values over multiple time periods.<br>The Mann-Kendall Test for Statistical Significance is used to evaluate the trend<br>over 4 to 10 periods of measure, subject to data availability and comparability.
County: Tarrant Households with One or More Types of Computing Devices
County: Tarrant Households with One or More Types of Computing Devices
96.5%
(2018-2022)
Compared to:
TX Counties
The distribution is based on data from 254 Texas counties.
U.S. Counties
The distribution is based on data from 3,133 U.S. counties and county equivalents.
TX Value
(94.8%)
The regional value is compared to the Texas State value.
US Value
(94.0%)
The regional value is compared to the national value.
Trend
This comparison measures the indicator’s values over multiple time periods.<br>The Mann-Kendall Test for Statistical Significance is used to evaluate the trend<br>over 4 to 10 periods of measure, subject to data availability and comparability.
County: Tarrant Persons with an Internet Subscription
County: Tarrant Persons with an Internet Subscription
93.7%
(2018-2022)
Compared to:
TX Counties
The distribution is based on data from 254 Texas counties.
U.S. Counties
The distribution is based on data from 3,133 U.S. counties and county equivalents.
TX Value
(90.4%)
The regional value is compared to the Texas State value.
US Value
(91.0%)
The regional value is compared to the national value.
Trend
This comparison measures the indicator’s values over multiple time periods.<br>The Mann-Kendall Test for Statistical Significance is used to evaluate the trend<br>over 4 to 10 periods of measure, subject to data availability and comparability.
County: Tarrant
Health / Heart Disease & Stroke
Value
Compared to:
County: Tarrant Adults who Experienced a Stroke
County: Tarrant Adults who Experienced a Stroke
2.9%
(2021)
Compared to:
TX Counties
The distribution is based on data from 254 Texas counties.
U.S. Counties
The distribution is based on data from 3,074 U.S. counties and county equivalents.
US Value
(3.3%)
The regional value is compared to the national value.
County: Tarrant Adults who Experienced Coronary Heart Disease
County: Tarrant Adults who Experienced Coronary Heart Disease
5.1%
(2021)
Compared to:
TX Counties
The distribution is based on data from 254 Texas counties.
U.S. Counties
The distribution is based on data from 3,074 U.S. counties and county equivalents.
US Value
(6.1%)
The regional value is compared to the national value.
County: Tarrant Adults who Have Taken Medications for High Blood Pressure
County: Tarrant Adults who Have Taken Medications for High Blood Pressure
75.8%
(2021)
Compared to:
TX Counties
The distribution is based on data from 254 Texas counties.
U.S. Counties
The distribution is based on data from 3,074 U.S. counties and county equivalents.
US Value
(78.2%)
The regional value is compared to the national value.
County: Tarrant Age-Adjusted Death Rate due to Cerebrovascular Disease (Stroke)
County: Tarrant Age-Adjusted Death Rate due to Cerebrovascular Disease (Stroke)
46.9
Deaths per 100,000 population
(2018-2020)
Compared to:
TX Counties
The distribution is based on data from 155 Texas counties.
U.S. Counties
The distribution is based on data from 2,338 U.S. counties and county equivalents.
TX Value
(40.1)
The regional value is compared to the Texas State value.
US Value
(37.6)
The regional value is compared to the national value.
Prior Value
(46.4)
Prior Value compares a measured value with the previously measured value. Confidence intervals were taken into account in determining the direction of the comparison.
Trend
This comparison measures the indicator’s values over multiple time periods.<br>The Mann-Kendall Test for Statistical Significance is used to evaluate the trend<br>over 4 to 10 periods of measure, subject to data availability and comparability.
HP 2030 Target
(33.4)
County: Tarrant Age-Adjusted Death Rate due to Coronary Heart Disease
County: Tarrant Age-Adjusted Death Rate due to Coronary Heart Disease
73.3
Deaths per 100,000 population
(2018-2020)
Compared to:
TX Counties
The distribution is based on data from 207 Texas counties.
U.S. Counties
The distribution is based on data from 2,852 U.S. counties and county equivalents.
TX Value
(93.7)
The regional value is compared to the Texas State value.
US Value
(90.2)
The regional value is compared to the national value.
Prior Value
(76.8)
Prior Value compares a measured value with the previously measured value. Confidence intervals were taken into account in determining the direction of the comparison.
Trend
This comparison measures the indicator’s values over multiple time periods.<br>The Mann-Kendall Test for Statistical Significance is used to evaluate the trend<br>over 4 to 10 periods of measure, subject to data availability and comparability.
HP 2030 Target
(71.1)
County: Tarrant Age-Adjusted Death Rate due to Heart Attack
County: Tarrant Age-Adjusted Death Rate due to Heart Attack
35.8
Deaths per 100,000 population 35+ years
(2020)
Compared to:
TX Counties
The distribution is based on data from 140 Texas counties.
TX Value
(63.2)
The regional value is compared to the Texas State value.
Prior Value
(37.9)
Prior Value compares a measured value with the previously measured value. Confidence intervals were not taken into account in determining the direction of the comparison.
Trend
This comparison measures the indicator’s values over multiple time periods.<br>The Mann-Kendall Test for Statistical Significance is used to evaluate the trend<br>over 4 to 10 periods of measure, subject to data availability and comparability.
County: Tarrant Atrial Fibrillation: Medicare Population
County: Tarrant Atrial Fibrillation: Medicare Population
14.0%
(2022)
Compared to:
TX Counties
The distribution is based on data from 254 Texas counties.
U.S. Counties
The distribution is based on data from 3,129 U.S. counties and county equivalents.
TX Value
(14.0%)
The regional value is compared to the Texas State value.
US Value
(14.0%)
The regional value is compared to the national value.
Prior Value
(14.0%)
Prior Value compares a measured value with the previously measured value. Confidence intervals were not taken into account in determining the direction of the comparison.
Trend
This comparison measures the indicator’s values over multiple time periods.<br>The Mann-Kendall Test for Statistical Significance is used to evaluate the trend<br>over 4 to 10 periods of measure, subject to data availability and comparability.
County: Tarrant Cholesterol Test History
County: Tarrant Cholesterol Test History
84.2%
(2021)
Compared to:
TX Counties
The distribution is based on data from 254 Texas counties.
U.S. Counties
The distribution is based on data from 3,074 U.S. counties and county equivalents.
US Value
(86.4%)
The regional value is compared to the national value.
County: Tarrant Heart Failure: Medicare Population
County: Tarrant Heart Failure: Medicare Population
12.0%
(2022)
Compared to:
TX Counties
The distribution is based on data from 254 Texas counties.
U.S. Counties
The distribution is based on data from 3,129 U.S. counties and county equivalents.
TX Value
(12.0%)
The regional value is compared to the Texas State value.
US Value
(11.0%)
The regional value is compared to the national value.
Prior Value
(12.0%)
Prior Value compares a measured value with the previously measured value. Confidence intervals were not taken into account in determining the direction of the comparison.
Trend
This comparison measures the indicator’s values over multiple time periods.<br>The Mann-Kendall Test for Statistical Significance is used to evaluate the trend<br>over 4 to 10 periods of measure, subject to data availability and comparability.
County: Tarrant High Blood Pressure Prevalence
County: Tarrant High Blood Pressure Prevalence
32.5%
(2021)
Compared to:
TX Counties
The distribution is based on data from 254 Texas counties.
U.S. Counties
The distribution is based on data from 3,074 U.S. counties and county equivalents.
US Value
(32.7%)
The regional value is compared to the national value.
HP 2030 Target
(41.9%)
County: Tarrant High Cholesterol Prevalence: Past 5 Years
County: Tarrant High Cholesterol Prevalence: Past 5 Years
37.3%
(2021)
Compared to:
TX Counties
The distribution is based on data from 254 Texas counties.
U.S. Counties
The distribution is based on data from 3,074 U.S. counties and county equivalents.
US Value
(36.4%)
The regional value is compared to the national value.
County: Tarrant Hyperlipidemia: Medicare Population
County: Tarrant Hyperlipidemia: Medicare Population
67.0%
(2022)
Compared to:
TX Counties
The distribution is based on data from 254 Texas counties.
U.S. Counties
The distribution is based on data from 3,129 U.S. counties and county equivalents.
TX Value
(65.0%)
The regional value is compared to the Texas State value.
US Value
(65.0%)
The regional value is compared to the national value.
Prior Value
(66.0%)
Prior Value compares a measured value with the previously measured value. Confidence intervals were not taken into account in determining the direction of the comparison.
Trend
This comparison measures the indicator’s values over multiple time periods.<br>The Mann-Kendall Test for Statistical Significance is used to evaluate the trend<br>over 4 to 10 periods of measure, subject to data availability and comparability.
County: Tarrant Hypertension: Medicare Population
County: Tarrant Hypertension: Medicare Population
66.0%
(2022)
Compared to:
TX Counties
The distribution is based on data from 254 Texas counties.
U.S. Counties
The distribution is based on data from 3,129 U.S. counties and county equivalents.
TX Value
(66.0%)
The regional value is compared to the Texas State value.
US Value
(65.0%)
The regional value is compared to the national value.
Prior Value
(67.0%)
Prior Value compares a measured value with the previously measured value. Confidence intervals were not taken into account in determining the direction of the comparison.
Trend
This comparison measures the indicator’s values over multiple time periods.<br>The Mann-Kendall Test for Statistical Significance is used to evaluate the trend<br>over 4 to 10 periods of measure, subject to data availability and comparability.
County: Tarrant Ischemic Heart Disease: Medicare Population
County: Tarrant Ischemic Heart Disease: Medicare Population
21.0%
(2022)
Compared to:
TX Counties
The distribution is based on data from 254 Texas counties.
U.S. Counties
The distribution is based on data from 3,129 U.S. counties and county equivalents.
TX Value
(22.0%)
The regional value is compared to the Texas State value.
US Value
(21.0%)
The regional value is compared to the national value.
Prior Value
(21.0%)
Prior Value compares a measured value with the previously measured value. Confidence intervals were not taken into account in determining the direction of the comparison.
Trend
This comparison measures the indicator’s values over multiple time periods.<br>The Mann-Kendall Test for Statistical Significance is used to evaluate the trend<br>over 4 to 10 periods of measure, subject to data availability and comparability.
County: Tarrant Stroke: Medicare Population
County: Tarrant Stroke: Medicare Population
6.0%
(2022)
Compared to:
TX Counties
The distribution is based on data from 254 Texas counties.
U.S. Counties
The distribution is based on data from 3,129 U.S. counties and county equivalents.
TX Value
(6.0%)
The regional value is compared to the Texas State value.
US Value
(6.0%)
The regional value is compared to the national value.
Prior Value
(6.0%)
Prior Value compares a measured value with the previously measured value. Confidence intervals were not taken into account in determining the direction of the comparison.
Trend
This comparison measures the indicator’s values over multiple time periods.<br>The Mann-Kendall Test for Statistical Significance is used to evaluate the trend<br>over 4 to 10 periods of measure, subject to data availability and comparability.
County: Tarrant
Health / Immunizations & Infectious Diseases
Value
Compared to:
County: Tarrant Age-Adjusted Death Rate due to Influenza and Pneumonia
County: Tarrant Age-Adjusted Death Rate due to Influenza and Pneumonia
12.5
Deaths per 100,000 population
(2018-2020)
Compared to:
U.S. Counties
The distribution is based on data from 1,449 U.S. counties and county equivalents.
TX Value
(12.1)
The regional value is compared to the Texas State value.
US Value
(13.4)
The regional value is compared to the national value.
Prior Value
(12.1)
Prior Value compares a measured value with the previously measured value. Confidence intervals were taken into account in determining the direction of the comparison.
Trend
This comparison measures the indicator’s values over multiple time periods.<br>The Mann-Kendall Test for Statistical Significance is used to evaluate the trend<br>over 4 to 10 periods of measure, subject to data availability and comparability.
County: Tarrant Conscientious Exemptions from Immunizations
County: Tarrant Conscientious Exemptions from Immunizations
2.9%
(2022-2023)
Compared to:
TX Counties
The distribution is based on data from 252 Texas counties.
TX Value
(2.0%)
The regional value is compared to the Texas State value.
Prior Value
(2.2%)
Prior Value compares a measured value with the previously measured value. Confidence intervals were not taken into account in determining the direction of the comparison.
Trend
This comparison measures the indicator’s values over multiple time periods.<br>The Mann-Kendall Test for Statistical Significance is used to evaluate the trend<br>over 4 to 10 periods of measure, subject to data availability and comparability.
County: Tarrant COVID-19 Daily Average Case-Fatality Rate
County: Tarrant COVID-19 Daily Average Case-Fatality Rate
1.1
Deaths per 100 cases
(Mar 3, 2023)
Compared to:
TX Counties
(Mar 11, 2022)
The distribution is based on data from 233 Texas counties.
U.S. Counties
(Mar 25, 2022)
The distribution is based on data from 2,811 U.S. counties and county equivalents.
TX Value
(1.8)
The regional value is compared to the Texas State value.
US Value
(1.7)
The regional value is compared to the national value.
Prior Value
(1.6)
Prior Value compares a measured value with the previously measured value. Confidence intervals were not taken into account in determining the direction of the comparison.
Trend
This comparison measures the indicator’s values over multiple time periods.<br>The Mann-Kendall Test for Statistical Significance is used to evaluate the trend<br>over 4 to 10 periods of measure, subject to data availability and comparability.
County: Tarrant COVID-19 Daily Average Incidence Rate
County: Tarrant COVID-19 Daily Average Incidence Rate
9.25
Cases per 100,000 population
(Mar 3, 2023)
Compared to:
TX Counties
The distribution is based on data from 254 Texas counties.
U.S. Counties
The distribution is based on data from 3,142 U.S. counties and county equivalents.
TX Value
(13.90)
The regional value is compared to the Texas State value.
US Value
(10.97)
The regional value is compared to the national value.
Prior Value
(6.93)
Prior Value compares a measured value with the previously measured value. Confidence intervals were not taken into account in determining the direction of the comparison.
Trend
This comparison measures the indicator’s values over multiple time periods.<br>The Mann-Kendall Test for Statistical Significance is used to evaluate the trend<br>over 4 to 10 periods of measure, subject to data availability and comparability.
County: Tarrant Flu Vaccinations: Medicare Population
County: Tarrant Flu Vaccinations: Medicare Population
49.0%
(2022)
Compared to:
TX Counties
The distribution is based on data from 254 Texas counties.
U.S. Counties
The distribution is based on data from 3,129 U.S. counties and county equivalents.
TX Value
(46.0%)
The regional value is compared to the Texas State value.
US Value
(50.0%)
The regional value is compared to the national value.
Prior Value
(48.0%)
Prior Value compares a measured value with the previously measured value. Confidence intervals were not taken into account in determining the direction of the comparison.
Trend
This comparison measures the indicator’s values over multiple time periods.<br>The Mann-Kendall Test for Statistical Significance is used to evaluate the trend<br>over 4 to 10 periods of measure, subject to data availability and comparability.
County: Tarrant Persons Fully Vaccinated Against COVID-19
County: Tarrant Persons Fully Vaccinated Against COVID-19
58.2%
(May 10, 2023)
Compared to:
TX Counties
The distribution is based on data from 254 Texas counties.
U.S. Counties
The distribution is based on data from 3,125 U.S. counties and county equivalents.
Prior Value
(58.2%)
Prior Value compares a measured value with the previously measured value. Confidence intervals were not taken into account in determining the direction of the comparison.
Trend
This comparison measures the indicator’s values over multiple time periods.<br>The Mann-Kendall Test for Statistical Significance is used to evaluate the trend<br>over 4 to 10 periods of measure, subject to data availability and comparability.
County: Tarrant Pneumonia Vaccinations: Medicare Population
County: Tarrant Pneumonia Vaccinations: Medicare Population
9.0%
(2022)
Compared to:

TX Counties
The distribution is based on data from 254 Texas counties.
U.S. Counties
The distribution is based on data from 3,129 U.S. counties and county equivalents.
TX Value
(8.0%)
The regional value is compared to the Texas State value.
US Value
(8.0%)
The regional value is compared to the national value.
Prior Value
(6.0%)
Prior Value compares a measured value with the previously measured value. Confidence intervals were not taken into account in determining the direction of the comparison.
Trend
This comparison measures the indicator’s values over multiple time periods.<br>The Mann-Kendall Test for Statistical Significance is used to evaluate the trend<br>over 4 to 10 periods of measure, subject to data availability and comparability.
County: Tarrant Tuberculosis Incidence Rate
County: Tarrant Tuberculosis Incidence Rate
3.2
Cases per 100,000 population
(2017-2021)
Compared to:
TX Counties
The distribution is based on data from 254 Texas counties.
TX Value
(3.9)
The regional value is compared to the Texas State value.
US Value
(2.4 in 2021)
The regional value is compared to the national value. The source for the national value is Centers for Disease Control and Prevention
Prior Value
(3.2)
Prior Value compares a measured value with the previously measured value. Confidence intervals were not taken into account in determining the direction of the comparison.
Trend
This comparison measures the indicator’s values over multiple time periods.<br>The Mann-Kendall Test for Statistical Significance is used to evaluate the trend<br>over 4 to 10 periods of measure, subject to data availability and comparability.
HP 2030 Target
(1.4)
County: Tarrant
Health / Maternal, Fetal & Infant Health
Value
Compared to:
County: Tarrant Babies with Low Birthweight
County: Tarrant Babies with Low Birthweight
8.3%
(2015)
Compared to:
TX Counties
The distribution is based on data from 210 Texas counties.
TX Value
(8.2%)
The regional value is compared to the Texas State value.
US Value
(8.1%)
The regional value is compared to the national value. The source for the national value is Centers for Disease Control and Prevention
Prior Value
(7.9%)
Prior Value compares a measured value with the previously measured value. Confidence intervals were not taken into account in determining the direction of the comparison.
Trend
This comparison measures the indicator’s values over multiple time periods.<br>The Mann-Kendall Test for Statistical Significance is used to evaluate the trend<br>over 4 to 10 periods of measure, subject to data availability and comparability.
County: Tarrant Babies with Very Low Birthweight
County: Tarrant Babies with Very Low Birthweight
1.4%
(2015)
Compared to:
TX Value
(1.4% in 2013)
The regional value is compared to the Texas State value.
US Value
(1.4%)
The regional value is compared to the national value. The source for the national value is Centers for Disease Control and Prevention
Prior Value
(1.5%)
Prior Value compares a measured value with the previously measured value. Confidence intervals were not taken into account in determining the direction of the comparison.
Trend
This comparison measures the indicator’s values over multiple time periods.<br>The Mann-Kendall Test for Statistical Significance is used to evaluate the trend<br>over 4 to 10 periods of measure, subject to data availability and comparability.
County: Tarrant Infant Mortality Rate
County: Tarrant Infant Mortality Rate
5.6
Deaths per 1,000 live births
(2019)
Compared to:
TX Counties
(2015)
The distribution is based on data from 165 Texas counties.
TX Value
(5.5)
The regional value is compared to the Texas State value.
US Value
(5.6)
The regional value is compared to the national value. The source for the national value is Centers for Disease Control and Prevention
Prior Value
(6.4)
Prior Value compares a measured value with the previously measured value. Confidence intervals were not taken into account in determining the direction of the comparison.
Trend
This comparison measures the indicator’s values over multiple time periods.<br>The Mann-Kendall Test for Statistical Significance is used to evaluate the trend<br>over 4 to 10 periods of measure, subject to data availability and comparability.
HP 2030 Target
(5.0)
<div>MICH-02: Reduce the rate of infant deaths <strong>(LEADING HEALTH INDICATOR)</strong></div>
County: Tarrant Mothers who Received Early Prenatal Care
County: Tarrant Mothers who Received Early Prenatal Care
61.3%
(2019)
Compared to:
TX Counties
The distribution is based on data from 253 Texas counties.
TX Value
(61.0%)
The regional value is compared to the Texas State value.
US Value
(75.8%)
The regional value is compared to the national value. The source for the national value is Centers for Disease Control and Prevention
Prior Value
(61.2%)
Prior Value compares a measured value with the previously measured value. Confidence intervals were not taken into account in determining the direction of the comparison.
Trend
This comparison measures the indicator’s values over multiple time periods.<br>The Mann-Kendall Test for Statistical Significance is used to evaluate the trend<br>over 4 to 10 periods of measure, subject to data availability and comparability.
County: Tarrant Preterm Births
County: Tarrant Preterm Births
12.7%
(2019)
Compared to:
TX Counties
The distribution is based on data from 190 Texas counties.
TX Value
(13.0%)
The regional value is compared to the Texas State value.
Prior Value
(13.1%)
Prior Value compares a measured value with the previously measured value. Confidence intervals were not taken into account in determining the direction of the comparison.
Trend
This comparison measures the indicator’s values over multiple time periods.<br>The Mann-Kendall Test for Statistical Significance is used to evaluate the trend<br>over 4 to 10 periods of measure, subject to data availability and comparability.
HP 2030 Target
(9.4%)
County: Tarrant
Health / Mental Health & Mental Disorders
Value
Compared to:
County: Tarrant Adults Ever Diagnosed with Depression
County: Tarrant Adults Ever Diagnosed with Depression
21.7%
(2021)
Compared to:
TX Counties
The distribution is based on data from 254 Texas counties.
U.S. Counties
The distribution is based on data from 3,074 U.S. counties and county equivalents.
US Value
(19.5%)
The regional value is compared to the national value.
County: Tarrant Age-Adjusted Death Rate due to Suicide
County: Tarrant Age-Adjusted Death Rate due to Suicide
12.9
Deaths per 100,000 population
(2018-2020)
Compared to:
U.S. Counties
The distribution is based on data from 1,307 U.S. counties and county equivalents.
TX Value
(13.5)
The regional value is compared to the Texas State value.
US Value
(13.9)
The regional value is compared to the national value.
Prior Value
(13.0)
Prior Value compares a measured value with the previously measured value. Confidence intervals were taken into account in determining the direction of the comparison.
Trend
This comparison measures the indicator’s values over multiple time periods.<br>The Mann-Kendall Test for Statistical Significance is used to evaluate the trend<br>over 4 to 10 periods of measure, subject to data availability and comparability.
HP 2030 Target
(12.8)
<div>MHMD-01: Reduce the suicide rate <strong>(LEADING HEALTH INDICATOR)</strong></div>
County: Tarrant Depression: Medicare Population
County: Tarrant Depression: Medicare Population
19.0%
(2022)
Compared to:
TX Counties
The distribution is based on data from 254 Texas counties.
U.S. Counties
The distribution is based on data from 3,129 U.S. counties and county equivalents.
TX Value
(17.0%)
The regional value is compared to the Texas State value.
US Value
(16.0%)
The regional value is compared to the national value.
Prior Value
(19.0%)
Prior Value compares a measured value with the previously measured value. Confidence intervals were not taken into account in determining the direction of the comparison.
Trend
This comparison measures the indicator’s values over multiple time periods.<br>The Mann-Kendall Test for Statistical Significance is used to evaluate the trend<br>over 4 to 10 periods of measure, subject to data availability and comparability.
County: Tarrant Frequent Mental Distress
County: Tarrant Frequent Mental Distress
13.2%
(2019)
Compared to:
TX Counties
The distribution is based on data from 254 Texas counties.
U.S. Counties
The distribution is based on data from 3,121 U.S. counties and county equivalents.
TX Value
(12.1%)
The regional value is compared to the Texas State value.
US Value
(14.0%)
The regional value is compared to the national value.
Prior Value
(13.8%)
Prior Value compares a measured value with the previously measured value. Confidence intervals were taken into account in determining the direction of the comparison.
County: Tarrant Mental Health Provider Rate
County: Tarrant Mental Health Provider Rate
179
Providers per 100,000 population
(2023)
Compared to:
TX Counties
The distribution is based on data from 220 Texas counties.
U.S. Counties
The distribution is based on data from 2,956 U.S. counties and county equivalents.
TX Value
(157)
The regional value is compared to the Texas State value.
Prior Value
(163)
Prior Value compares a measured value with the previously measured value. Confidence intervals were not taken into account in determining the direction of the comparison.
Trend
This comparison measures the indicator’s values over multiple time periods.<br>The Mann-Kendall Test for Statistical Significance is used to evaluate the trend<br>over 4 to 10 periods of measure, subject to data availability and comparability.
County: Tarrant Poor Mental Health: 14+ Days
County: Tarrant Poor Mental Health: 14+ Days
16.0%
(2021)
Compared to:
TX Counties
The distribution is based on data from 254 Texas counties.
U.S. Counties
The distribution is based on data from 3,074 U.S. counties and county equivalents.
US Value
(14.7%)
The regional value is compared to the national value.
County: Tarrant
Health / Mortality Data
Value
Compared to:
County: Tarrant Life Expectancy
County: Tarrant Life Expectancy
77.5
Years
(2019-2021)
Compared to:
TX Counties
The distribution is based on data from 237 Texas counties.
U.S. Counties
The distribution is based on data from 3,070 U.S. counties and county equivalents.
TX Value
(77.2)
The regional value is compared to the Texas State value.
US Value
(77.6)
The regional value is compared to the national value.
County: Tarrant
Health / Older Adults
Value
Compared to:
County: Tarrant Adults 65+ who Received Recommended Preventive Services: Females
County: Tarrant Adults 65+ who Received Recommended Preventive Services: Females
39.8%
(2020)
Compared to:
TX Counties
The distribution is based on data from 254 Texas counties.
U.S. Counties
The distribution is based on data from 3,141 U.S. counties and county equivalents.
US Value
(37.9%)
The regional value is compared to the national value.
County: Tarrant Adults 65+ who Received Recommended Preventive Services: Males
County: Tarrant Adults 65+ who Received Recommended Preventive Services: Males
47.5%
(2020)
Compared to:
TX Counties
The distribution is based on data from 254 Texas counties.
U.S. Counties
The distribution is based on data from 3,141 U.S. counties and county equivalents.
US Value
(43.7%)
The regional value is compared to the national value.
County: Tarrant Adults 65+ with a Disability
County: Tarrant Adults 65+ with a Disability
32.4%
(2018-2022)
Compared to:
TX Value
(35.6%)
The regional value is compared to the Texas State value.
US Value
(33.3%)
The regional value is compared to the national value.
Trend
This comparison measures the indicator’s values over multiple time periods.<br>The Mann-Kendall Test for Statistical Significance is used to evaluate the trend<br>over 4 to 10 periods of measure, subject to data availability and comparability.
County: Tarrant Adults 65+ with a Hearing Difficulty
County: Tarrant Adults 65+ with a Hearing Difficulty
12.8%
(2018-2022)
Compared to:
TX Value
(14.7%)
The regional value is compared to the Texas State value.
US Value
(13.7%)
The regional value is compared to the national value.
Trend
This comparison measures the indicator’s values over multiple time periods.<br>The Mann-Kendall Test for Statistical Significance is used to evaluate the trend<br>over 4 to 10 periods of measure, subject to data availability and comparability.
County: Tarrant Adults 65+ with a Self-Care Difficulty
County: Tarrant Adults 65+ with a Self-Care Difficulty
7.1%
(2018-2022)
Compared to:
TX Value
(8.2%)
The regional value is compared to the Texas State value.
US Value
(7.4%)
The regional value is compared to the national value.
Trend
This comparison measures the indicator’s values over multiple time periods.<br>The Mann-Kendall Test for Statistical Significance is used to evaluate the trend<br>over 4 to 10 periods of measure, subject to data availability and comparability.
County: Tarrant Adults 65+ with a Vision Difficulty
County: Tarrant Adults 65+ with a Vision Difficulty
6.5%
(2018-2022)
Compared to:
TX Value
(7.4%)
The regional value is compared to the Texas State value.
US Value
(6.0%)
The regional value is compared to the national value.
Trend
This comparison measures the indicator’s values over multiple time periods.<br>The Mann-Kendall Test for Statistical Significance is used to evaluate the trend<br>over 4 to 10 periods of measure, subject to data availability and comparability.
County: Tarrant Adults 65+ with an Independent Living Difficulty
County: Tarrant Adults 65+ with an Independent Living Difficulty
12.8%
(2018-2022)
Compared to:
TX Value
(14.4%)
The regional value is compared to the Texas State value.
US Value
(13.6%)
The regional value is compared to the national value.
Trend
This comparison measures the indicator’s values over multiple time periods.<br>The Mann-Kendall Test for Statistical Significance is used to evaluate the trend<br>over 4 to 10 periods of measure, subject to data availability and comparability.
County: Tarrant Alzheimer's Disease or Dementia: Medicare Population
County: Tarrant Alzheimer's Disease or Dementia: Medicare Population
8.0%
(2022)
Compared to:
TX Counties
The distribution is based on data from 254 Texas counties.
U.S. Counties
The distribution is based on data from 3,129 U.S. counties and county equivalents.
TX Value
(7.0%)
The regional value is compared to the Texas State value.
US Value
(6.0%)
The regional value is compared to the national value.
Prior Value
(8.0%)
Prior Value compares a measured value with the previously measured value. Confidence intervals were not taken into account in determining the direction of the comparison.
Trend
This comparison measures the indicator’s values over multiple time periods.<br>The Mann-Kendall Test for Statistical Significance is used to evaluate the trend<br>over 4 to 10 periods of measure, subject to data availability and comparability.
County: Tarrant
Health / Oral Health
Value
Compared to:
County: Tarrant Adults 65+ with Total Tooth Loss
County: Tarrant Adults 65+ with Total Tooth Loss
10.7%
(2020)
Compared to:
TX Counties
The distribution is based on data from 254 Texas counties.
U.S. Counties
The distribution is based on data from 3,141 U.S. counties and county equivalents.
US Value
(13.4%)
The regional value is compared to the national value.
County: Tarrant Adults who have had Permanent Teeth Extracted
County: Tarrant Adults who have had Permanent Teeth Extracted
42.9%
(2012)
Compared to:
TX Value
(42.8%)
The regional value is compared to the Texas State value.
US Value
(44.5%)
The regional value is compared to the national value.
County: Tarrant Adults who Visited a Dentist
County: Tarrant Adults who Visited a Dentist
55.6%
(2020)
Compared to:
TX Counties
The distribution is based on data from 254 Texas counties.
U.S. Counties
The distribution is based on data from 3,141 U.S. counties and county equivalents.
US Value
(64.8%)
The regional value is compared to the national value.
County: Tarrant Dentist Rate
County: Tarrant Dentist Rate
64
Dentists per 100,000 population
(2022)
Compared to:
TX Counties
The distribution is based on data from 242 Texas counties.
U.S. Counties
The distribution is based on data from 3,054 U.S. counties and county equivalents.
TX Value
(63)
The regional value is compared to the Texas State value.
Prior Value
(63)
Prior Value compares a measured value with the previously measured value. Confidence intervals were not taken into account in determining the direction of the comparison.
Trend
This comparison measures the indicator’s values over multiple time periods.<br>The Mann-Kendall Test for Statistical Significance is used to evaluate the trend<br>over 4 to 10 periods of measure, subject to data availability and comparability.
County: Tarrant
Health / Other Conditions
Value
Compared to:
County: Tarrant Adults with Arthritis
County: Tarrant Adults with Arthritis
20.9%
(2021)
Compared to:
TX Counties
The distribution is based on data from 254 Texas counties.
U.S. Counties
The distribution is based on data from 3,074 U.S. counties and county equivalents.
US Value
(25.2%)
The regional value is compared to the national value.
County: Tarrant Adults with Kidney Disease
County: Tarrant Adults with Kidney Disease
2.9%
(2021)
Compared to:
TX Counties
The distribution is based on data from 254 Texas counties.
U.S. Counties
The distribution is based on data from 3,074 U.S. counties and county equivalents.
US Value
(3.1%)
The regional value is compared to the national value.
County: Tarrant Chronic Kidney Disease: Medicare Population
County: Tarrant Chronic Kidney Disease: Medicare Population
21.0%
(2022)
Compared to:
TX Counties
The distribution is based on data from 254 Texas counties.
U.S. Counties
The distribution is based on data from 3,129 U.S. counties and county equivalents.
TX Value
(18.0%)
The regional value is compared to the Texas State value.
US Value
(18.0%)
The regional value is compared to the national value.
Prior Value
(21.0%)
Prior Value compares a measured value with the previously measured value. Confidence intervals were not taken into account in determining the direction of the comparison.
Trend
This comparison measures the indicator’s values over multiple time periods.<br>The Mann-Kendall Test for Statistical Significance is used to evaluate the trend<br>over 4 to 10 periods of measure, subject to data availability and comparability.
County: Tarrant Osteoporosis: Medicare Population
County: Tarrant Osteoporosis: Medicare Population
11.0%
(2022)
Compared to:
TX Counties
The distribution is based on data from 254 Texas counties.
U.S. Counties
The distribution is based on data from 3,129 U.S. counties and county equivalents.
TX Value
(11.0%)
The regional value is compared to the Texas State value.
US Value
(11.0%)
The regional value is compared to the national value.
Prior Value
(10.0%)
Prior Value compares a measured value with the previously measured value. Confidence intervals were not taken into account in determining the direction of the comparison.
Trend
This comparison measures the indicator’s values over multiple time periods.<br>The Mann-Kendall Test for Statistical Significance is used to evaluate the trend<br>over 4 to 10 periods of measure, subject to data availability and comparability.
County: Tarrant Rheumatoid Arthritis or Osteoarthritis: Medicare Population
County: Tarrant Rheumatoid Arthritis or Osteoarthritis: Medicare Population
36.0%
(2022)
Compared to:
TX Counties
The distribution is based on data from 254 Texas counties.
U.S. Counties
The distribution is based on data from 3,129 U.S. counties and county equivalents.
TX Value
(35.0%)
The regional value is compared to the Texas State value.
US Value
(35.0%)
The regional value is compared to the national value.
Prior Value
(36.0%)
Prior Value compares a measured value with the previously measured value. Confidence intervals were not taken into account in determining the direction of the comparison.
Trend
This comparison measures the indicator’s values over multiple time periods.<br>The Mann-Kendall Test for Statistical Significance is used to evaluate the trend<br>over 4 to 10 periods of measure, subject to data availability and comparability.
County: Tarrant
Health / Physical Activity
Value
Compared to:
County: Tarrant Adults 20+ who are Sedentary
County: Tarrant Adults 20+ who are Sedentary
21.0%
(2021)
Compared to:
TX Counties
The distribution is based on data from 254 Texas counties.
U.S. Counties
The distribution is based on data from 3,074 U.S. counties and county equivalents.
Prior Value
(21.2%)
Prior Value compares a measured value with the previously measured value. Confidence intervals were taken into account in determining the direction of the comparison.
Trend
This comparison measures the indicator’s values over multiple time periods.<br>The Mann-Kendall Test for Statistical Significance is used to evaluate the trend<br>over 4 to 10 periods of measure, subject to data availability and comparability.
County: Tarrant
Health / Prevention & Safety
Value
Compared to:
County: Tarrant Age-Adjusted Death Rate due to Firearms
County: Tarrant Age-Adjusted Death Rate due to Firearms
12.3
Deaths per 100,000 population
(2018-2020)
Compared to:
U.S. Counties
The distribution is based on data from 1,083 U.S. counties and county equivalents.
TX Value
(12.6)
The regional value is compared to the Texas State value.
US Value
(12.0)
The regional value is compared to the national value.
Prior Value
(11.6)
Prior Value compares a measured value with the previously measured value. Confidence intervals were taken into account in determining the direction of the comparison.
Trend
This comparison measures the indicator’s values over multiple time periods.<br>The Mann-Kendall Test for Statistical Significance is used to evaluate the trend<br>over 4 to 10 periods of measure, subject to data availability and comparability.
HP 2030 Target
(10.7)
County: Tarrant Age-Adjusted Death Rate due to Unintentional Injuries
County: Tarrant Age-Adjusted Death Rate due to Unintentional Injuries
35.0
Deaths per 100,000 population
(2018-2020)
Compared to:
TX Counties
The distribution is based on data from 164 Texas counties.
U.S. Counties
The distribution is based on data from 2,454 U.S. counties and county equivalents.
TX Value
(40.6)
The regional value is compared to the Texas State value.
US Value
(51.6)
The regional value is compared to the national value.
Prior Value
(32.0)
Prior Value compares a measured value with the previously measured value. Confidence intervals were taken into account in determining the direction of the comparison.
Trend
This comparison measures the indicator’s values over multiple time periods.<br>The Mann-Kendall Test for Statistical Significance is used to evaluate the trend<br>over 4 to 10 periods of measure, subject to data availability and comparability.
HP 2030 Target
(43.2)
County: Tarrant
Health / Respiratory Diseases
Value
Compared to:
County: Tarrant Adults with Asthma
County: Tarrant Adults with Asthma
10.8%
(2012)
Compared to:
TX Value
(10.9%)
The regional value is compared to the Texas State value.
US Value
(13.3%)
The regional value is compared to the national value.
Prior Value
(11.9%)
Prior Value compares a measured value with the previously measured value. Confidence intervals were taken into account in determining the direction of the comparison.
County: Tarrant Adults with COPD
County: Tarrant Adults with COPD
6.2%
Percent of adults
(2021)
Compared to:
TX Counties
The distribution is based on data from 254 Texas counties.
U.S. Counties
The distribution is based on data from 3,074 U.S. counties and county equivalents.
US Value
(6.4%)
The regional value is compared to the national value.
County: Tarrant Adults with Current Asthma
County: Tarrant Adults with Current Asthma
9.7%
(2021)
Compared to:
TX Counties
The distribution is based on data from 254 Texas counties.
U.S. Counties
The distribution is based on data from 3,074 U.S. counties and county equivalents.
US Value
(9.7%)
The regional value is compared to the national value.
County: Tarrant Asthma: Medicare Population
County: Tarrant Asthma: Medicare Population
8.0%
(2022)
Compared to:
TX Counties
The distribution is based on data from 254 Texas counties.
U.S. Counties
The distribution is based on data from 3,129 U.S. counties and county equivalents.
TX Value
(7.0%)
The regional value is compared to the Texas State value.
US Value
(7.0%)
The regional value is compared to the national value.
Prior Value
(8.0%)
Prior Value compares a measured value with the previously measured value. Confidence intervals were not taken into account in determining the direction of the comparison.
Trend
This comparison measures the indicator’s values over multiple time periods.<br>The Mann-Kendall Test for Statistical Significance is used to evaluate the trend<br>over 4 to 10 periods of measure, subject to data availability and comparability.
County: Tarrant COPD: Medicare Population
County: Tarrant COPD: Medicare Population
11.0%
(2022)
Compared to:
TX Counties
The distribution is based on data from 254 Texas counties.
U.S. Counties
The distribution is based on data from 3,129 U.S. counties and county equivalents.
TX Value
(11.0%)
The regional value is compared to the Texas State value.
US Value
(11.0%)
The regional value is compared to the national value.
Prior Value
(11.0%)
Prior Value compares a measured value with the previously measured value. Confidence intervals were not taken into account in determining the direction of the comparison.
Trend
This comparison measures the indicator’s values over multiple time periods.<br>The Mann-Kendall Test for Statistical Significance is used to evaluate the trend<br>over 4 to 10 periods of measure, subject to data availability and comparability.
County: Tarrant
Health / Sexually Transmitted Infections
Value
Compared to:
County: Tarrant Chlamydia Incidence Rate
County: Tarrant Chlamydia Incidence Rate
459.1
Cases per 100,000 population
(2018)
Compared to:
TX Counties
The distribution is based on data from 254 Texas counties.
TX Value
(508.2)
The regional value is compared to the Texas State value.
US Value
(539.9)
The regional value is compared to the national value. The source for the national value is National Center for HIV/AIDS, Viral Hepatitis, STD, and TB Prevention
Prior Value
(408.2)
Prior Value compares a measured value with the previously measured value. Confidence intervals were not taken into account in determining the direction of the comparison.
Trend
This comparison measures the indicator’s values over multiple time periods.<br>The Mann-Kendall Test for Statistical Significance is used to evaluate the trend<br>over 4 to 10 periods of measure, subject to data availability and comparability.
County: Tarrant Gonorrhea Incidence Rate
County: Tarrant Gonorrhea Incidence Rate
154.0
Cases per 100,000 population
(2018)
Compared to:
TX Counties
The distribution is based on data from 254 Texas counties.
TX Value
(163.6)
The regional value is compared to the Texas State value.
US Value
(179.1)
The regional value is compared to the national value. The source for the national value is National Center for HIV/AIDS, Viral Hepatitis, STD, and TB Prevention
Prior Value
(134.3)
Prior Value compares a measured value with the previously measured value. Confidence intervals were not taken into account in determining the direction of the comparison.
Trend
This comparison measures the indicator’s values over multiple time periods.<br>The Mann-Kendall Test for Statistical Significance is used to evaluate the trend<br>over 4 to 10 periods of measure, subject to data availability and comparability.
County: Tarrant HIV Diagnosis Rate
County: Tarrant HIV Diagnosis Rate
14.5
Cases per 100,000 population
(2019)
Compared to:
TX Counties
The distribution is based on data from 254 Texas counties.
TX Value
(14.5)
The regional value is compared to the Texas State value.
Prior Value
(13.2)
Prior Value compares a measured value with the previously measured value. Confidence intervals were not taken into account in determining the direction of the comparison.
Trend
This comparison measures the indicator’s values over multiple time periods.<br>The Mann-Kendall Test for Statistical Significance is used to evaluate the trend<br>over 4 to 10 periods of measure, subject to data availability and comparability.
County: Tarrant Syphilis Incidence Rate
County: Tarrant Syphilis Incidence Rate
13.6
Cases per 100,000 population
(2018)
Compared to:
TX Value
(8.8)
The regional value is compared to the Texas State value.
US Value
(10.8)
The regional value is compared to the national value. The source for the national value is National Center for HIV/AIDS, Viral Hepatitis, STD, and TB Prevention
Prior Value
(9.4)
Prior Value compares a measured value with the previously measured value. Confidence intervals were not taken into account in determining the direction of the comparison.
Trend
This comparison measures the indicator’s values over multiple time periods.<br>The Mann-Kendall Test for Statistical Significance is used to evaluate the trend<br>over 4 to 10 periods of measure, subject to data availability and comparability.
County: Tarrant
Health / Tobacco Use
Value
Compared to:
County: Tarrant Adults who Smoke
County: Tarrant Adults who Smoke
14.7%
(2021)
Compared to:
TX Counties
The distribution is based on data from 254 Texas counties.
U.S. Counties
The distribution is based on data from 3,074 U.S. counties and county equivalents.
US Value
(13.5%)
The regional value is compared to the national value.
HP 2030 Target
(6.1%)
<div>TU-02: Reduce current cigarette smoking in adults <strong>(LEADING HEALTH INDICATOR)</strong></div>
County: Tarrant
Health / Weight Status
Value
Compared to:
County: Tarrant Adults 20+ Who Are Obese
County: Tarrant Adults 20+ Who Are Obese
33.8%
(2021)
Compared to:
TX Counties
The distribution is based on data from 254 Texas counties.
U.S. Counties
The distribution is based on data from 3,074 U.S. counties and county equivalents.
Prior Value
(35.3%)
Prior Value compares a measured value with the previously measured value. Confidence intervals were taken into account in determining the direction of the comparison.
Trend
This comparison measures the indicator’s values over multiple time periods.<br>The Mann-Kendall Test for Statistical Significance is used to evaluate the trend<br>over 4 to 10 periods of measure, subject to data availability and comparability.
HP 2030 Target
(36.0%)
County: Tarrant
Health / Wellness & Lifestyle
Value
Compared to:
County: Tarrant Frequent Physical Distress
County: Tarrant Frequent Physical Distress
11.9%
(2019)
Compared to:
TX Counties
The distribution is based on data from 254 Texas counties.
U.S. Counties
The distribution is based on data from 3,121 U.S. counties and county equivalents.
TX Value
(10.6%)
The regional value is compared to the Texas State value.
US Value
(12.0%)
The regional value is compared to the national value.
Prior Value
(12.9%)
Prior Value compares a measured value with the previously measured value. Confidence intervals were taken into account in determining the direction of the comparison.
County: Tarrant Insufficient Sleep
County: Tarrant Insufficient Sleep
34.1%
(2020)
Compared to:
TX Counties
The distribution is based on data from 253 Texas counties.
U.S. Counties
The distribution is based on data from 3,140 U.S. counties and county equivalents.
TX Value
(33.4%)
The regional value is compared to the Texas State value.
US Value
(33.0%)
The regional value is compared to the national value.
Prior Value
(33.0%)
Prior Value compares a measured value with the previously measured value. Confidence intervals were not taken into account in determining the direction of the comparison.
HP 2030 Target
(26.7%)
County: Tarrant Poor Physical Health: 14+ Days
County: Tarrant Poor Physical Health: 14+ Days
11.3%
(2021)
Compared to:
TX Counties
The distribution is based on data from 254 Texas counties.
U.S. Counties
The distribution is based on data from 3,074 U.S. counties and county equivalents.
US Value
(10.9%)
The regional value is compared to the national value.
County: Tarrant Self-Reported General Health Assessment: Poor or Fair
County: Tarrant Self-Reported General Health Assessment: Poor or Fair
18.3%
(2021)
Compared to:
TX Counties
The distribution is based on data from 254 Texas counties.
U.S. Counties
The distribution is based on data from 3,074 U.S. counties and county equivalents.
US Value
(16.1%)
The regional value is compared to the national value.
County: Tarrant
Community / Civic Engagement
Value
Compared to:
County: Tarrant Voter Turnout: Presidential Election
County: Tarrant Voter Turnout: Presidential Election
62.0%
(2016)
Compared to:
TX Counties
The distribution is based on data from 254 Texas counties.
TX Value
(58.8%)
The regional value is compared to the Texas State value.
Prior Value
(62.6%)
Prior Value compares a measured value with the previously measured value. Confidence intervals were not taken into account in determining the direction of the comparison.
Trend
This comparison measures the indicator’s values over multiple time periods.<br>The Mann-Kendall Test for Statistical Significance is used to evaluate the trend<br>over 4 to 10 periods of measure, subject to data availability and comparability.
HP 2030 Target
(58.4%)
<div>SDOH-07: Increase the proportion of the voting-age citizens who vote</div>
County: Tarrant
Community / Crime & Crime Prevention
Value
Compared to:
County: Tarrant Age-Adjusted Death Rate due to Homicide
County: Tarrant Age-Adjusted Death Rate due to Homicide
5.9
Deaths per 100,000 population
(2018-2020)
Compared to:
U.S. Counties
The distribution is based on data from 495 U.S. counties and county equivalents.
TX Value
(6.3)
The regional value is compared to the Texas State value.
US Value
(6.6)
The regional value is compared to the national value.
Prior Value
(5.2)
Prior Value compares a measured value with the previously measured value. Confidence intervals were taken into account in determining the direction of the comparison.
Trend
This comparison measures the indicator’s values over multiple time periods.<br>The Mann-Kendall Test for Statistical Significance is used to evaluate the trend<br>over 4 to 10 periods of measure, subject to data availability and comparability.
HP 2030 Target
(5.5)
<div>IVP-09: Reduce homicides <strong>(LEADING HEALTH INDICATOR)</strong></div>
County: Tarrant
Community / Demographics
Value
Compared to:
County: Tarrant Average Household Size
County: Tarrant Average Household Size
2.80
Persons per household
(2018-2022)
Compared to:
TX Value
(2.70)
The regional value is compared to the Texas State value.
US Value
(2.60)
The regional value is compared to the national value.
Trend
This comparison measures the indicator’s values over multiple time periods.<br>The Mann-Kendall Test for Statistical Significance is used to evaluate the trend<br>over 4 to 10 periods of measure, subject to data availability and comparability.
County: Tarrant Female Population
County: Tarrant Female Population
50.8%
(2022)
Compared to:
TX Value
(50.0%)
The regional value is compared to the Texas State value.
US Value
(50.4%)
The regional value is compared to the national value.
Prior Value
(50.7%)
Prior Value compares a measured value with the previously measured value. Confidence intervals were not taken into account in determining the direction of the comparison.
Trend
This comparison measures the indicator’s values over multiple time periods.<br>The Mann-Kendall Test for Statistical Significance is used to evaluate the trend<br>over 4 to 10 periods of measure, subject to data availability and comparability.
County: Tarrant Foreign Born Persons
County: Tarrant Foreign Born Persons
16.3%
(2018-2022)
Compared to:

TX Value
(17.1%)
The regional value is compared to the Texas State value.
US Value
(13.7%)
The regional value is compared to the national value.
Trend
This comparison measures the indicator’s values over multiple time periods.<br>The Mann-Kendall Test for Statistical Significance is used to evaluate the trend<br>over 4 to 10 periods of measure, subject to data availability and comparability.
County: Tarrant Households
County: Tarrant Households
754,969
Households
(2018-2022)
Compared to:
Trend
This comparison measures the indicator’s values over multiple time periods.<br>The Mann-Kendall Test for Statistical Significance is used to evaluate the trend<br>over 4 to 10 periods of measure, subject to data availability and comparability.
County: Tarrant Male Population
County: Tarrant Male Population
49.2%
(2022)
Compared to:
TX Value
(50.0%)
The regional value is compared to the Texas State value.
US Value
(49.6%)
The regional value is compared to the national value.
Prior Value
(49.3%)
Prior Value compares a measured value with the previously measured value. Confidence intervals were not taken into account in determining the direction of the comparison.
Trend
This comparison measures the indicator’s values over multiple time periods.<br>The Mann-Kendall Test for Statistical Significance is used to evaluate the trend<br>over 4 to 10 periods of measure, subject to data availability and comparability.
29.3%
(2018-2022)
Compared to:
TX Value
(35.1%)
The regional value is compared to the Texas State value.
US Value
(21.7%)
The regional value is compared to the national value.
Trend
This comparison measures the indicator’s values over multiple time periods.<br>The Mann-Kendall Test for Statistical Significance is used to evaluate the trend<br>over 4 to 10 periods of measure, subject to data availability and comparability.
County: Tarrant Population American Indian and Alaska Native
County: Tarrant Population American Indian and Alaska Native
0.9%
(2022)
Compared to:
TX Value
(1.1%)
The regional value is compared to the Texas State value.
US Value
(1.3%)
The regional value is compared to the national value.
Prior Value
(0.9%)
Prior Value compares a measured value with the previously measured value. Confidence intervals were not taken into account in determining the direction of the comparison.
Trend
This comparison measures the indicator’s values over multiple time periods.<br>The Mann-Kendall Test for Statistical Significance is used to evaluate the trend<br>over 4 to 10 periods of measure, subject to data availability and comparability.
County: Tarrant Population Asian
County: Tarrant Population Asian
6.2%
(2022)
Compared to:
TX Value
(5.7%)
The regional value is compared to the Texas State value.
US Value
(6.3%)
The regional value is compared to the national value.
Prior Value
(6.0%)
Prior Value compares a measured value with the previously measured value. Confidence intervals were not taken into account in determining the direction of the comparison.
Trend
This comparison measures the indicator’s values over multiple time periods.<br>The Mann-Kendall Test for Statistical Significance is used to evaluate the trend<br>over 4 to 10 periods of measure, subject to data availability and comparability.
County: Tarrant Population Black or African American
County: Tarrant Population Black or African American
19.0%
(2022)
Compared to:
TX Value
(13.4%)
The regional value is compared to the Texas State value.
US Value
(13.6%)
The regional value is compared to the national value.
Prior Value
(18.6%)
Prior Value compares a measured value with the previously measured value. Confidence intervals were not taken into account in determining the direction of the comparison.
Trend
This comparison measures the indicator’s values over multiple time periods.<br>The Mann-Kendall Test for Statistical Significance is used to evaluate the trend<br>over 4 to 10 periods of measure, subject to data availability and comparability.
County: Tarrant Population Hispanic or Latino
County: Tarrant Population Hispanic or Latino
30.5%
(2022)
Compared to:
TX Value
(40.2%)
The regional value is compared to the Texas State value.
US Value
(19.1%)
The regional value is compared to the national value.
Prior Value
(30.2%)
Prior Value compares a measured value with the previously measured value. Confidence intervals were not taken into account in determining the direction of the comparison.
Trend
This comparison measures the indicator’s values over multiple time periods.<br>The Mann-Kendall Test for Statistical Significance is used to evaluate the trend<br>over 4 to 10 periods of measure, subject to data availability and comparability.
County: Tarrant Population Native Hawaiian and Other Pacific Islander
County: Tarrant Population Native Hawaiian and Other Pacific Islander
0.3%
(2022)
Compared to:
TX Value
(0.2%)
The regional value is compared to the Texas State value.
US Value
(0.3%)
The regional value is compared to the national value.
Prior Value
(0.3%)
Prior Value compares a measured value with the previously measured value. Confidence intervals were not taken into account in determining the direction of the comparison.
Trend
This comparison measures the indicator’s values over multiple time periods.<br>The Mann-Kendall Test for Statistical Significance is used to evaluate the trend<br>over 4 to 10 periods of measure, subject to data availability and comparability.
County: Tarrant Population Over Age 65
County: Tarrant Population Over Age 65
12.3%
(2022)
Compared to:
TX Value
(13.4%)
The regional value is compared to the Texas State value.
US Value
(17.3%)
The regional value is compared to the national value.
Prior Value
(12.0%)
Prior Value compares a measured value with the previously measured value. Confidence intervals were not taken into account in determining the direction of the comparison.
Trend
This comparison measures the indicator’s values over multiple time periods.<br>The Mann-Kendall Test for Statistical Significance is used to evaluate the trend<br>over 4 to 10 periods of measure, subject to data availability and comparability.
County: Tarrant Population Over Age 65 (Count)
County: Tarrant Population Over Age 65 (Count)
247,826
People
(2018-2022)
Compared to:
Trend
This comparison measures the indicator’s values over multiple time periods.<br>The Mann-Kendall Test for Statistical Significance is used to evaluate the trend<br>over 4 to 10 periods of measure, subject to data availability and comparability.
County: Tarrant Population Two or More Races
County: Tarrant Population Two or More Races
2.8%
(2022)
Compared to:
TX Value
(2.3%)
The regional value is compared to the Texas State value.
US Value
(3.0%)
The regional value is compared to the national value.
Prior Value
(2.7%)
Prior Value compares a measured value with the previously measured value. Confidence intervals were not taken into account in determining the direction of the comparison.
Trend
This comparison measures the indicator’s values over multiple time periods.<br>The Mann-Kendall Test for Statistical Significance is used to evaluate the trend<br>over 4 to 10 periods of measure, subject to data availability and comparability.
County: Tarrant Population Under Age 18
County: Tarrant Population Under Age 18
25.2%
(2022)
Compared to:
TX Value
(24.8%)
The regional value is compared to the Texas State value.
US Value
(21.7%)
The regional value is compared to the national value.
Prior Value
(25.5%)
Prior Value compares a measured value with the previously measured value. Confidence intervals were not taken into account in determining the direction of the comparison.
Trend
This comparison measures the indicator’s values over multiple time periods.<br>The Mann-Kendall Test for Statistical Significance is used to evaluate the trend<br>over 4 to 10 periods of measure, subject to data availability and comparability.
County: Tarrant Population Under Age 5
County: Tarrant Population Under Age 5
6.3%
(2022)
Compared to:
TX Value
(6.3%)
The regional value is compared to the Texas State value.
US Value
(5.6%)
The regional value is compared to the national value.
Prior Value
(6.4%)
Prior Value compares a measured value with the previously measured value. Confidence intervals were not taken into account in determining the direction of the comparison.
Trend
This comparison measures the indicator’s values over multiple time periods.<br>The Mann-Kendall Test for Statistical Significance is used to evaluate the trend<br>over 4 to 10 periods of measure, subject to data availability and comparability.
County: Tarrant Population White
County: Tarrant Population White
70.9%
(2022)
Compared to:
TX Value
(77.4%)
The regional value is compared to the Texas State value.
US Value
(75.5%)
The regional value is compared to the national value.
Prior Value
(71.5%)
Prior Value compares a measured value with the previously measured value. Confidence intervals were not taken into account in determining the direction of the comparison.
Trend
This comparison measures the indicator’s values over multiple time periods.<br>The Mann-Kendall Test for Statistical Significance is used to evaluate the trend<br>over 4 to 10 periods of measure, subject to data availability and comparability.
County: Tarrant Population White (Not Hispanic or Latino)
County: Tarrant Population White (Not Hispanic or Latino)
42.8%
(2022)
Compared to:
TX Value
(39.8%)
The regional value is compared to the Texas State value.
US Value
(58.9%)
The regional value is compared to the national value.
Prior Value
(43.6%)
Prior Value compares a measured value with the previously measured value. Confidence intervals were not taken into account in determining the direction of the comparison.
Trend
This comparison measures the indicator’s values over multiple time periods.<br>The Mann-Kendall Test for Statistical Significance is used to evaluate the trend<br>over 4 to 10 periods of measure, subject to data availability and comparability.
County: Tarrant Total Population
County: Tarrant Total Population
2,182,947
People
(2023)
Compared to:
Prior Value
(2,155,646)
Prior Value compares a measured value with the previously measured value. Confidence intervals were not taken into account in determining the direction of the comparison.
Trend
This comparison measures the indicator’s values over multiple time periods.<br>The Mann-Kendall Test for Statistical Significance is used to evaluate the trend<br>over 4 to 10 periods of measure, subject to data availability and comparability.
County: Tarrant Veteran Population
County: Tarrant Veteran Population
6.7%
(2018-2022)
Compared to:
TX Value
(6.5%)
The regional value is compared to the Texas State value.
US Value
(6.6%)
The regional value is compared to the national value.
Trend
This comparison measures the indicator’s values over multiple time periods.<br>The Mann-Kendall Test for Statistical Significance is used to evaluate the trend<br>over 4 to 10 periods of measure, subject to data availability and comparability.
County: Tarrant
Community / Public Safety
Value
Compared to:
County: Tarrant Age-Adjusted Death Rate due to Motor Vehicle Traffic Collisions
County: Tarrant Age-Adjusted Death Rate due to Motor Vehicle Traffic Collisions
10.1
Deaths per 100,000 population
(2018-2020)
Compared to:
TX Counties
(2014-2018)
The distribution is based on data from 136 Texas counties.
U.S. Counties
The distribution is based on data from 1,266 U.S. counties and county equivalents.
TX Value
(12.9)
The regional value is compared to the Texas State value.
US Value
(11.4)
The regional value is compared to the national value.
Prior Value
(9.7)
Prior Value compares a measured value with the previously measured value. Confidence intervals were taken into account in determining the direction of the comparison.
Trend
This comparison measures the indicator’s values over multiple time periods.<br>The Mann-Kendall Test for Statistical Significance is used to evaluate the trend<br>over 4 to 10 periods of measure, subject to data availability and comparability.
HP 2030 Target
(10.1)
County: Tarrant Alcohol-Impaired Driving Deaths
County: Tarrant Alcohol-Impaired Driving Deaths
22.6%
Percent of driving deaths with alcohol involvement
(2017-2021)
Compared to:
TX Counties
The distribution is based on data from 254 Texas counties.
U.S. Counties
The distribution is based on data from 3,116 U.S. counties and county equivalents.
TX Value
(25.2%)
The regional value is compared to the Texas State value.
US Value
(26.3%)
The regional value is compared to the national value.
Prior Value
(21.9%)
Prior Value compares a measured value with the previously measured value. Confidence intervals were taken into account in determining the direction of the comparison.
Trend
This comparison measures the indicator’s values over multiple time periods.<br>The Mann-Kendall Test for Statistical Significance is used to evaluate the trend<br>over 4 to 10 periods of measure, subject to data availability and comparability.
County: Tarrant
Community / Social Environment
Value
Compared to:
County: Tarrant Children in Single-Parent Households
County: Tarrant Children in Single-Parent Households
25.1%
(2018-2022)
Compared to:
TX Counties
The distribution is based on data from 254 Texas counties.
U.S. Counties
The distribution is based on data from 3,132 U.S. counties and county equivalents.
TX Value
(25.6%)
The regional value is compared to the Texas State value.
US Value
(24.9%)
The regional value is compared to the national value.
Trend
This comparison measures the indicator’s values over multiple time periods.<br>The Mann-Kendall Test for Statistical Significance is used to evaluate the trend<br>over 4 to 10 periods of measure, subject to data availability and comparability.
County: Tarrant Linguistic Isolation
County: Tarrant Linguistic Isolation
5.4%
(2018-2022)
Compared to:
TX Counties
The distribution is based on data from 215 Texas counties.
U.S. Counties
The distribution is based on data from 2,252 U.S. counties and county equivalents.
TX Value
(7.0%)
The regional value is compared to the Texas State value.
US Value
(4.2%)
The regional value is compared to the national value.
Trend
This comparison measures the indicator’s values over multiple time periods.<br>The Mann-Kendall Test for Statistical Significance is used to evaluate the trend<br>over 4 to 10 periods of measure, subject to data availability and comparability.
County: Tarrant People 65+ Living Alone (Count)
County: Tarrant People 65+ Living Alone (Count)
60,195
People
(2018-2022)
Compared to:
Trend
This comparison measures the indicator’s values over multiple time periods.<br>The Mann-Kendall Test for Statistical Significance is used to evaluate the trend<br>over 4 to 10 periods of measure, subject to data availability and comparability.
County: Tarrant Social Associations
County: Tarrant Social Associations
7.0
Membership associations per 10,000 population
(2021)
Compared to:
TX Counties
The distribution is based on data from 254 Texas counties.
U.S. Counties
The distribution is based on data from 3,141 U.S. counties and county equivalents.
TX Value
(7.4)
The regional value is compared to the Texas State value.
US Value
(9.1)
The regional value is compared to the national value.
Prior Value
(6.9)
Prior Value compares a measured value with the previously measured value. Confidence intervals were not taken into account in determining the direction of the comparison.
Trend
This comparison measures the indicator’s values over multiple time periods.<br>The Mann-Kendall Test for Statistical Significance is used to evaluate the trend<br>over 4 to 10 periods of measure, subject to data availability and comparability.
County: Tarrant Social Worker Rate
County: Tarrant Social Worker Rate
118
Workers per 100,000 population
(2020)
Compared to:
TX Counties
The distribution is based on data from 254 Texas counties.
TX Value
(83)
The regional value is compared to the Texas State value.
Prior Value
(118)
Prior Value compares a measured value with the previously measured value. Confidence intervals were not taken into account in determining the direction of the comparison.
Trend
This comparison measures the indicator’s values over multiple time periods.<br>The Mann-Kendall Test for Statistical Significance is used to evaluate the trend<br>over 4 to 10 periods of measure, subject to data availability and comparability.
County: Tarrant Substantiated Child Abuse Rate
County: Tarrant Substantiated Child Abuse Rate
11.5
Cases per 1,000 children
(2020)
Compared to:
TX Counties
The distribution is based on data from 241 Texas counties.
TX Value
(9.1)
The regional value is compared to the Texas State value.
US Value
(9.2 in 2019)
The regional value is compared to the national value. The source for the national value is Children's Bureau
Prior Value
(10.3)
Prior Value compares a measured value with the previously measured value. Confidence intervals were not taken into account in determining the direction of the comparison.
Trend
This comparison measures the indicator’s values over multiple time periods.<br>The Mann-Kendall Test for Statistical Significance is used to evaluate the trend<br>over 4 to 10 periods of measure, subject to data availability and comparability.
HP 2030 Target
(8.7)
County: Tarrant
Community / Transportation
Value
Compared to:
County: Tarrant Mean Travel Time to Work
County: Tarrant Mean Travel Time to Work
26.8
Minutes
(2018-2022)
Compared to:
TX Counties
The distribution is based on data from 252 Texas counties.
U.S. Counties
The distribution is based on data from 3,131 U.S. counties and county equivalents.
TX Value
(26.6)
The regional value is compared to the Texas State value.
US Value
(26.7)
The regional value is compared to the national value.
Trend
This comparison measures the indicator’s values over multiple time periods.<br>The Mann-Kendall Test for Statistical Significance is used to evaluate the trend<br>over 4 to 10 periods of measure, subject to data availability and comparability.
