
Analyze Secondary Data
This site contains a wide variety of indicators from national and state data sources that you can review and analyze to help in your community health needs assessment process.
Secondary data refers to data about your community that has already been collected by various organizations. Much of this data is available for you to access on this site. A strong secondary data analysis allows for an objective start to looking at the health needs of your community and can help inform your community input gathering.
-
Step 1: Compare to Other Locations
-
COMMUNITY DASHBOARD
Depending on your site's geography and availability of the data from the data source, indicators may compare to other state counties, U.S. counties, state value, or U.S. value. You may wish to compare to a single location or multiple locations. Use the Build a Dashboard tool to select the comparison(s) you wish to view.
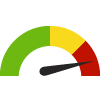 If comparing to other counties, these indicators will have the red, yellow, and green divided gauge. When the needle is in the green, he selected county’s value is the top best half (50%). When the needle is in the yellow, the selected county’s value is in the bottom worst half (50%). And when the needle is in the red, the selected county's value is in the worst quartile (25%) of all counties.
  If comparing to a state or national value, these indicators will have a diamond-shaped single value icon. The arrow in the icon indicates if the indicator value is higher than, lower than or relatively equal to a state or national value. A green-colored icon represents the indicator value is better than the comparison value. A red-colored icon represents the indicator value is worse than the comparison value.
 From the indicator detail page, you can easily save the chart that displays all location types by clicking on the 3 horizontal lines or by selecting download CSV to save all available location data.
-
Step 2: Compare to Healthy People 2030
-
HEALTHY PEOPLE 2030
Healthy People 2030 objectives are set by the US Department of Health and Human Services. These nationwide targets provide a benchmark for all communities to work towards.
-
Step 3: Compare to Historical Data
-
TIME TREND
It is important to know how your community is changing over time. From a customized or curated dashboard, you will see a Prior Value of an indicator which compares to the previous measurement period and the Trend over Time which compares to a multi-year trend. From an indicator detail page, you can also view the Change over Time graph to see changes for that indicator's value over several time periods.
-
Step 4: Identify Disparities
-
IDENTIFY DISPARITIES
This dashboard allows you to view all breakout data, when available, for all indicators at once to find race/ethnicity, gender or age disparities. Consider using the Index of Disparity method to summarize disparities across groups and indicators.
SOCIONEEDS INDEX® SUITE
You may also want to consider geographic disparities. Social and economic factors are well known to be strong determinants of health outcomes. Use the SocioNeeds Index® Suite to explore which locations (e.g., counties, zip codes, census tracts) in your service area have the highest relative socioeconomic need for a range of topics.
Quick Tip: Understanding and identifying health disparities is a key step in the community health improvement process. Even if your community as a whole is meeting targets and performing well, health disparities within your community can still exist. It is necessary to understand the root causes of these disparities to successfully address and reduce them moving forward. Learn more at NACCHO's Roots of Health Inequity.
-
Step 5: Establish a Method for Your Analysis
-
In order to standardize and make your needs assessment replicable in the future, it is important to establish a clear method of how you identified community needs in your secondary data analysis. Clearly explain what criteria/methodology you used to identify your community needs.
Sample Method
"In order to determine our community needs, all indicators were analyzed on the following criteria:- Is the indicator in the red or yellow?
- Is it failing to meet the national HP2030 or local target?
- Is it trending in the wrong direction?
- Is there an apparent disparity?
If the answer to any of these question is 'yes' the indicator was identified as a need. Once indicators were identified they were grouped and examined by topic area. These topic areas were identified as community needs."
-
Tips for The Final Report
-
METHODOLOGY SECTION
In the methodology section include information about where and when you accessed the secondary data. Also include any parties with whom you collaborated or contracted with for assistance in conducting the secondary data analysis.Sample Text
The secondary data was collected and analyzed through www.sitename.org, a web-based community health data platform developed by Conduent Healthy Communities Institute and sponsored by General Hospital. The site brings non-biased data, local resources, and reporting tools to one accessible, user-friendly location. The site includes a comprehensive dashboard of over 100 community indicators covering over 20 topics in the areas of health, determinants of health, and quality of life. The data is primarily derived from state and national public secondary data sources.APPENDIX SECTION
In the appendix make sure to include a list of data sources that you used including source name, URL of data, and measurement year. If you have administrative privileges, you can download all indicator information (including data measurement year and source name) in CSV format. -
From the IRS
-
A hospital facility's CHNA report will be considered to describe the process and methods used to conduct the CHNA for purposes of paragraph (b)(6)(i)(B) of this section if the CHNA report describes the data and other information used in the assessment, as well as the methods of collecting and analyzing this data and information, and identifies any parties with whom the hospital facility collaborated, or with whom it contracted for assistance, in conducting the CHNA. In the case of data obtained from external source material, the CHNA report may cite the source material rather than describe the method of collecting the data.
Have Questions? Contact Us